U.S. Tile Consumption Overview
U.S. ceramic tile consumption through 2Q 2014 was 1.21 billion sq. ft. (-1.1% vs. 2Q 2013 YTD). If the trend continues for the remainder of the year, this would be the first year-over-year decline in consumption since 2009.
The following table shows U.S. tile shipments, imports, exports, and total consumption in thousands of sq. ft.
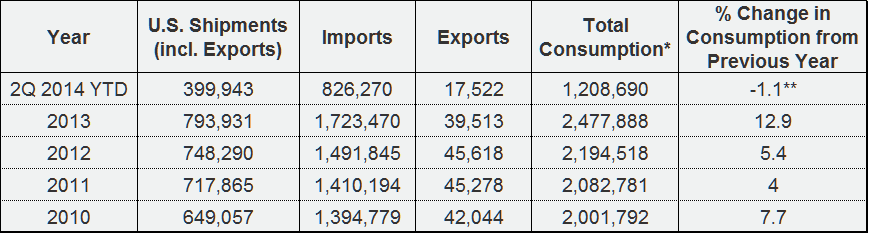
*Note: U.S. Shipments + Imports – Exports
**Note: % change vs. 2Q 2013 YTD
Imports
Through 2Q 2014, 826.3 million sq. ft. of ceramic tile arrived in the U.S. This was a 1.3% decrease from 2Q 2013 YTD, in which 837.3 million sq. ft. of ceramic tile were imported into the U.S., but a 13.3% increase from 2Q 2012 YTD.
Import penetration through 2Q 2014 was 68.4%, down from 69.6% in 2013.
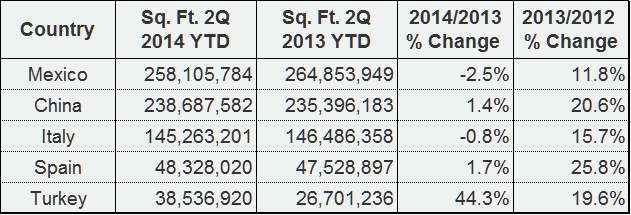
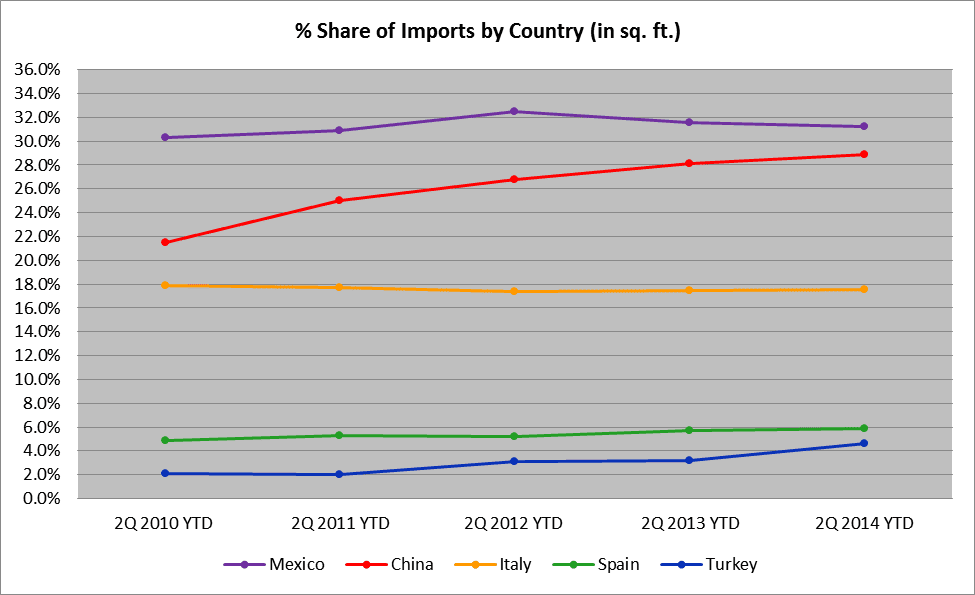
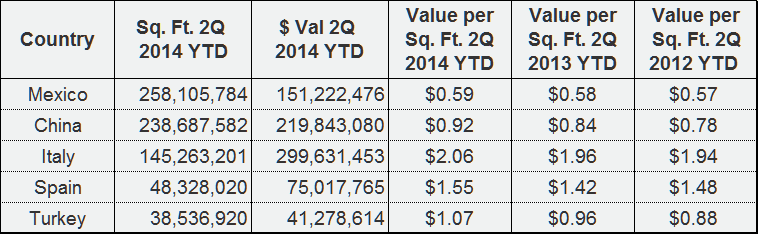
Through 2Q 2014 Mexico was the top exporter to the U.S. in sq. ft. with a 31.2% share of U.S. imports (in sq. ft.). China was in second place, making up 28.9% of imports, followed by Italy with a 17.6% share.
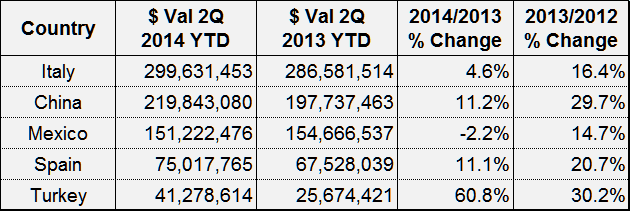
On a dollar basis Italy remained the top exporter to the U.S. (2Q 2014 YTD), comprising 34.6% of U.S. imports. China was second with a 25.4% share, and Mexico was third with a 17.4% share.
The $ value/sq. ft. of all tile imports rose from $0.99 (2Q 2013 YTD) to $1.05 for 2Q 2014 YTD.
The top five countries from which tiles were imported through 2Q 2014 based on sq. ft. were:
The top five countries from which tiles were imported through 2Q 2014 based on total U.S. $ value (including duty, freight, and insurance) were:
The average values of tile from the top five countries (based on sq. ft.) from which tiles were imported through 2Q 2014 were:
U.S. Shipments
2Q 2014 YTD U.S. shipments (less exports) were at 382.4 million sq. ft., down 0.7% from 2Q 2013 YTD.
Exports
U.S. exports through 2Q 2014 were at 17.5 million sq. ft., down 19.1% vs. 2Q 2013 YTD. The vast majority of these exports (in sq. ft.) were to Canada (60.0%) and Mexico (19.0%).
(Sources: TCNA and U.S. Commerce Dept.)
Economic highlights
-
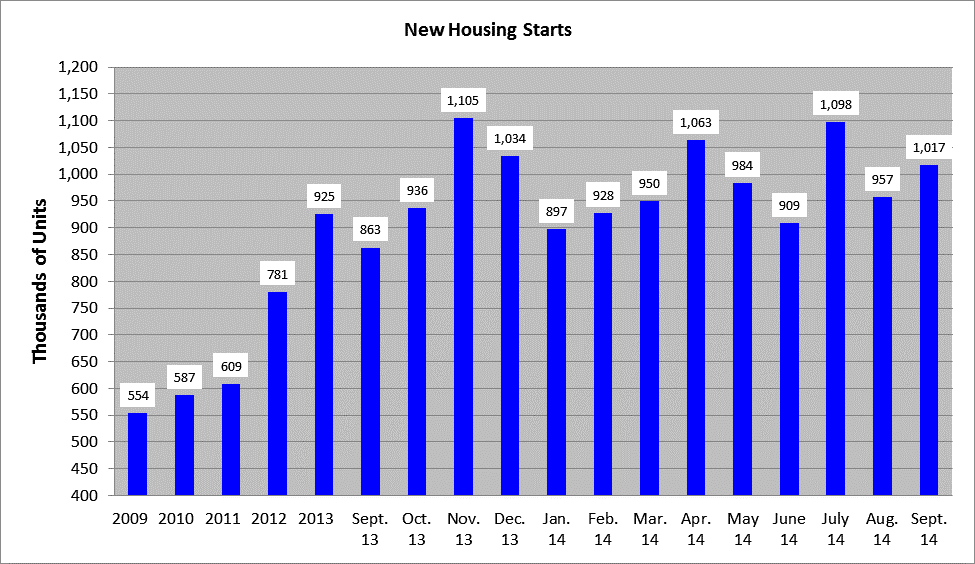
Sept. 2014 new single family home starts were up 17.8% from Sept. 2013 to an annualized rate of 1,017,000 units/yr.1
-
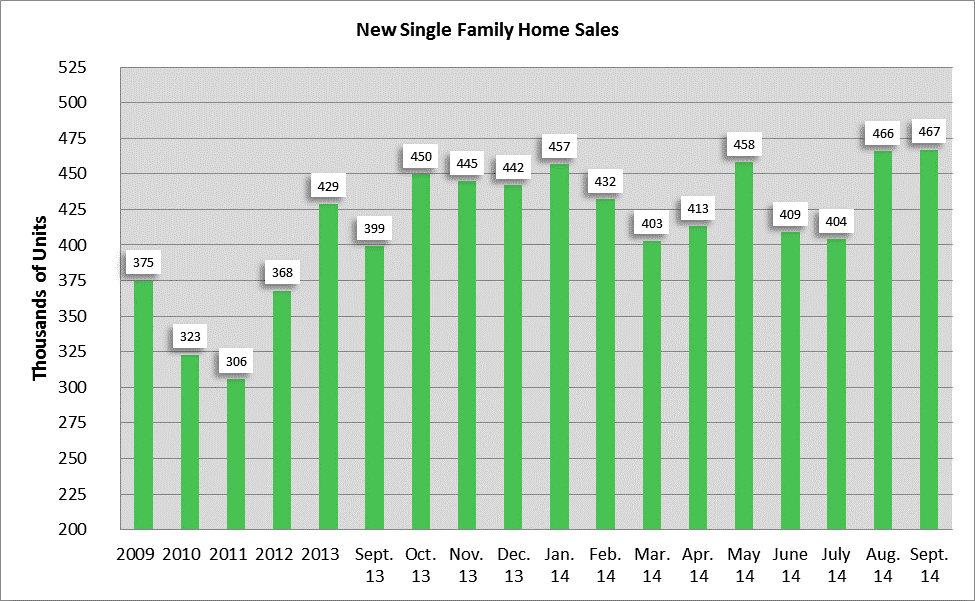
Sept. 2014 new home sales were up 17.0% from Sept. 2013 to an annualized rate of 467,000 units/yr.2
-
Existing home sales as of Sept. 2014 were at an annual rate of 4.56 million units, down 1.9% from Sept. 2013.3
-
There were 107,000 foreclosure filings on U.S. properties in Sept. 2014, down 18.6% vs. Sept. 2013, and the lowest monthly total since July 2006.4
-
The 30-year fixed mortgage rate in Sept. 2014 was 4.16%, down from 4.49% in Sept. 2013.5
-
The U.S. unemployment rate was 5.9% in Sept. 2014, down from 7.2% one year ago (Sept. 2013).6
-
Sept. 2014 total U.S. construction spending (includes both private and public residential and non-residential construction) was at a seasonally-adjusted annual rate of $951 billion, a 2.9% increase from Sept. 2013.7
-
The government’s preliminary 3Q 2014 estimate of the change in real GDP was 3.5%. This was a decrease of 1.1 percentage points from the change seen in 2Q 2014.8

Notes
- U.S. Census Bureau
- U.S. Census Bureau
- National Association of Realtors
- RealtyTrac
- Freddie Mac
- Bureau of Labor Statistics
- U.S. Census Bureau
- Bureau of Economic Analysis
###
Click here for a printable PDF version of this report.

0 Comments