Bolstered by the improving construction and housing markets, the U.S. economy and ceramic tile industry continued to expand in 2013.
In the residential market new home starts increased for the fourth straight year and were at their highest annual level since 2007. The 925,000 units started in 2013 represented an 18.5% increase from the previous year.1
New home sales, with which ceramic tile sales are closely linked, were at a five-year high of 430,000 units, up 16.8% vs. 2012. In spite of this increase, new home sales were only a third of what they were at their peak level in 2005 (1.28 million units).2
Existing home sales in 2013 rose 8.6% from 2012 to 4.48 million units, the highest level since 2006.3 Existing home sales especially affect remodeling, as buyers often look to update their newly purchased home.
Adding to the good news on the residential front was a sharp decrease in foreclosures. Foreclosure filings, which are another important indicator of the U.S. housing sector’s health, declined by 25.9% in 2013 to 1.36 million units. This represented the lowest annual total of foreclosures since 2007 and was a 52.6% decrease from the all-time high level in 2010.4
The 30-year fixed mortgage rate rose to 3.98% in 2013, up from 3.66% in 2012. Though up from the previous year, the 2013 rate was still the second lowest on record.5
The U.S. unemployment rate in 2013 was 7.4%, down from 8.1% in the previous year and the lowest annual rate since 2008.6
U.S. construction spending (includes both private and public residential and non-residential construction) in 2013 was $899 billion, a 4.9% increase from 2012.7
U.S. Tile Consumption Overview
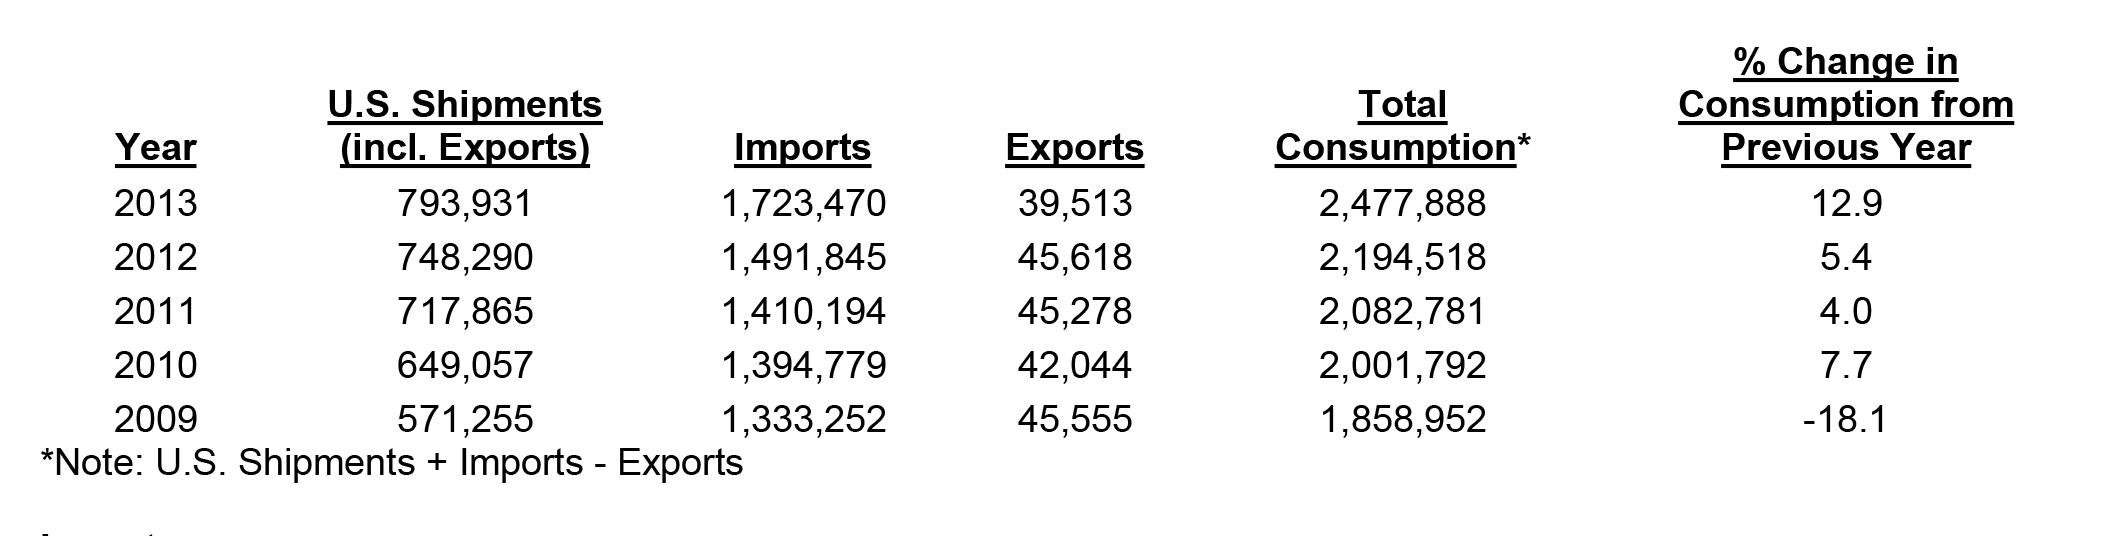
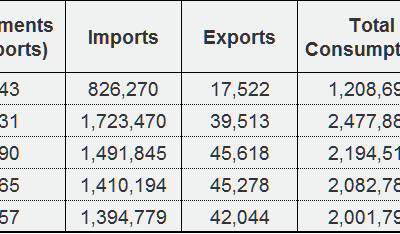
U.S. ceramic tile consumption in 2013 was 2.48 billion sq. ft. (+12.9% vs. 2012). This marked the fourth consecutive year of growth for the industry.
The following table shows U.S. tile shipments, imports, exports, and total consumption in thousands of sq. ft.
Imports
In 2013, 1.72 billion sq. ft. of ceramic tile arrived in the U.S. This was a 15.5% increase from 2012, in which 1.49 billion sq. ft. of ceramic tile were imported into the U.S., and a 22.2% increase from 2011.
Import penetration was at 69.6% in 2013, up from 68.0% in the previous year.
For the first time China ended a year as the top exporter to the U.S. (in. sq. ft.). China held a 30.1% share of U.S. imports (in sq. ft.) in 2013, followed by Mexico (29.8% share) and Italy (17.3% share).
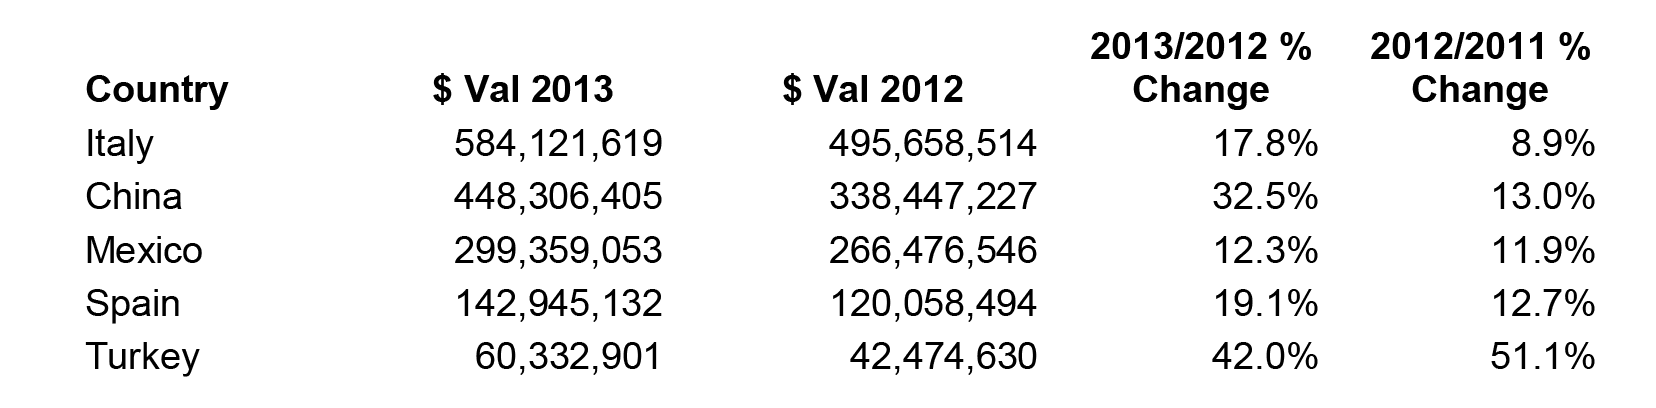
On a dollar basis Italy remained the top exporter to the U.S. in 2013, comprising 33.9% of U.S. imports. China was second with a 26.0% share, followed by Mexico with a 17.4% share.
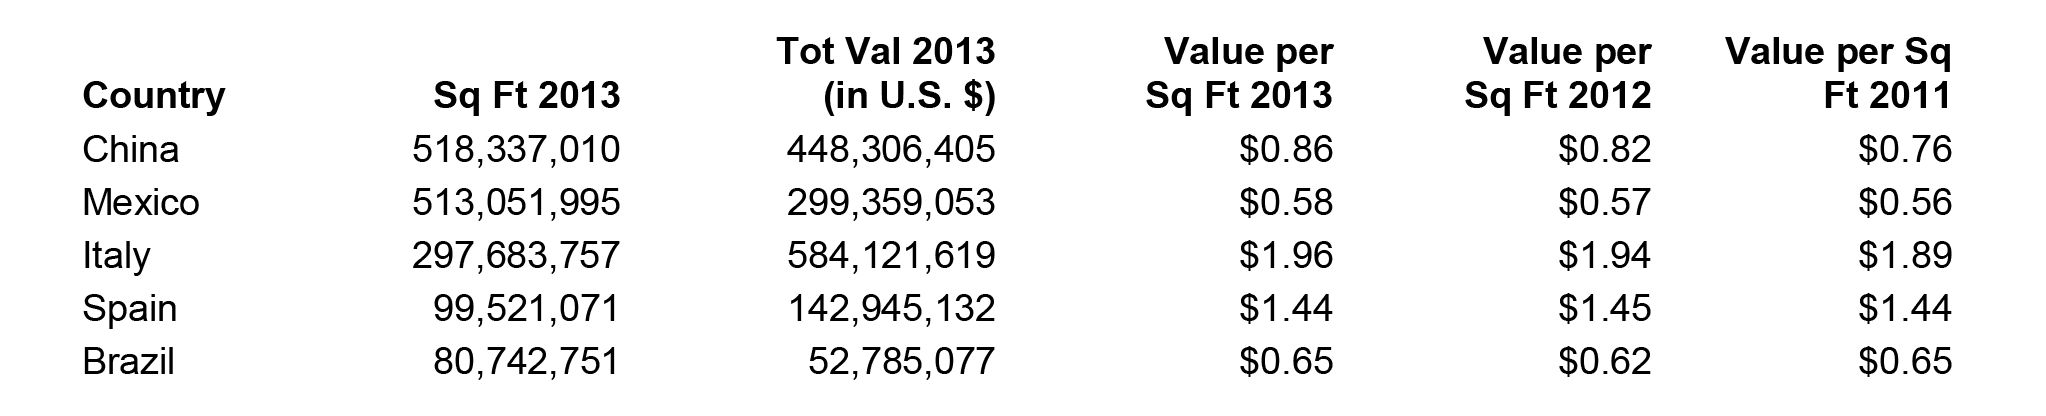
The $ value/sq. ft. of all tile imports rose from $0.97 in 2012 to $1.00 in 2013.
The top five countries from which tiles were imported in 2013 based on sq. ft. were:

The top five countries from which tiles were imported in 2013 based on total U.S. $ value (including duty, freight, and insurance) were:
The average values of tile from the top five countries (based on sq. ft.) from which tiles were imported in 2013 were:
U.S. Shipments
U.S. shipments (less exports) were at 754.4 million sq. ft. in 2013, up 7.4% from 2012.
Exports
U.S. exports in 2013 were at 39.5 million sq. ft., down 13.4% vs. 2012. The vast majority of these exports (in sq. ft.) were to Canada (63.4%) and Mexico (17.4%).
(Source: U.S. Commerce Dept.)
Notes
- U.S. Census Bureau
- U.S. Census Bureau
- National Association of Realtors
- RealtyTrac
- Freddie Mac
- Bureau of Labor Statistics
- U.S. Census Bureau
###
0 Comments