Economic Overview
Bolstered by the improving housing market, the U.S. economy and ceramic tile industry continued to expand in 3Q 2013.
U.S. unemployment continued to steadily decline through 3Q. As of Sept. the rate was at7.2%, down from 7.8% in Sept. 2012 (source: Bureau of Labor Statistics).
According to the U.S. Census Bureau, new home starts in Sept. were at a seasonally-adjusted annual rate of873,000 units, up 2.2% from Sept. 2012.
New home sales rose 4.9%from Sept. 2012 to Sept. 2013 to a seasonally-adjusted annual rateof 403,000units, per the U.S. Census Bureau. Existing home salesalso were up, rising 10.9% from an annual rate of 4.22 million units in Sept. 2012 to 4.68 million units in Sept. 2013 (source: National Association of Realtors).
30-year fixed rate mortgages steadily rose during 3Q and as of Sept. were at 4.49%, the highest rate since July 2011 (source: Freddie Mac).
Sept. 2013 U.S. construction spending (including both private and public residential and non-residential construction) was at a seasonally-adjusted annual rate of $917billion, a 6.3% increasefrom Sept. 2012 (source: U.S. Census Bureau).
U.S. Tile Consumption Overview
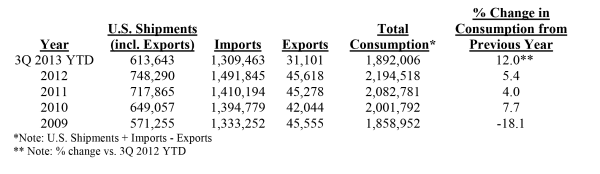
Through 3Q 2013 U.S. ceramic tile consumption was up 12.0% from 3Q 2012 YTD.
The following table shows U.S. shipments, imports, exports, and consumption in thousands of sq. ft.
Imports
Through 3Q 2013 YTD, 1.31 billion sq. ft. of ceramic tile arrived in the U.S. This was an increase of 14.0% from 3Q 2012 YTD, in which 1.15 billion sq. ft. of ceramic tile were imported into the U.S. and a 20.6% increase from 3Q 2011 YTD.
Import penetration was at 69.2% through 3Q 2013 YTD, up from 68.0% through 3Q 2012 YTD.
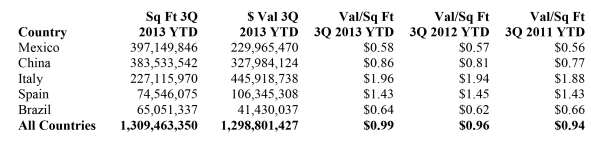
Mexico remained the top exporter in sq. ft. to the U.S. through 3Q 2013 YTD with a 30.3% share. China held the second position, making up 29.3% of imports (in sq. ft.). Italy was in third place with a 17.3% share.
On a dollar basis Italy continued to hold the top exporter position, making up 34.3% of U.S. imports. The next two highest shares belonged to China and Mexico, which had 25.3% and 17.7% of the $ value of U.S. imports, respectively.
The $ value/sq. ft. of all tile imports rose from $0.96 (3Q 2012 YTD) to $0.99 for 3Q 2013 YTD.
The top five countries from which tiles were imported through 3Q 2013 YTD based on sq. ft. were:

The average values of tile from the top five countries (based on sq. ft.) from which tiles were imported through 3Q 2013 YTD were:

The average values of tile from the top five countries (based on sq. ft.) from which tiles were imported through 3Q 2013 YTD were:
U.S. Shipments
U.S. shipments (less exports) were at 582.5 million sq. ft. through 3Q 2013 YTD, up 7.9% from 3Q 2012 YTD.
Exports
U.S. exports through 3Q 2013 YTD were at 31.1 million sq. ft., down 11.9% vs. 3Q 2012 YTD. The main countries to which these exports (in sq. ft.) were shipped were Canada (62.2%), Mexico (17.7%), and China (4.5%).
(Source: TCNA & U.S. Census Bureau)

0 Comments