Economic Overview
At the halfway point in 2013, the U.S. economy continued to show marked improvement vs. 2012.
According to the U.S. Census Bureau, new home starts in June rose to a seasonally-adjusted annual rate of 846,000 units, up 11.8% from June 2012.
New home sales soared 38.1% from June 2012 to June 2013 to a seasonally-adjusted annual rate of 497,000 units, per the U.S. Census Bureau. Existing home sales also were up, rising 14.5% from 3.93 million units in June 2012 to 4.50 million units in June 2013 (source: National Association of Realtors).
In more good news for the economy, unemployment continued to decline midway through the year. As of June the U.S. unemployment rate was at 7.6%, down from 8.2% in June 2012 (Bureau of Labor Statistics).
30-year fixed rate mortgages steadily rose during 2Q and as of June were at 4.07%, up from 3.68% in June 2012 (Freddie Mac).
The Census Bureau reported June 2013 U.S. construction spending (including both private and public residential and non-residential construction) to be at a seasonally-adjusted annual rate of $884 billion, a 3.3% increase from June 2012.
U.S. Tile Consumption Overview
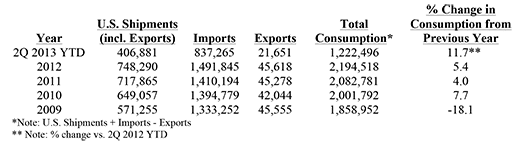
Midway through 2013 U.S. ceramic tile consumption was up 11.7% from 2Q 2012 YTD.
The following table shows U.S. shipments, imports, exports, and consumption in thousands of sq. ft.
Imports
Through 2Q 2013 YTD, 837.3 million sq. ft. of ceramic tile arrived in the U.S. This was an increase of 14.8% from 2Q 2012 YTD, in which 729.3 million sq. ft. of ceramic tile were imported into the U.S. and an 18.2% increase from 2Q 2011 YTD.
Import penetration was at 68.5% through 2Q 2013 YTD, up from 66.7% through 2Q 2012 YTD.
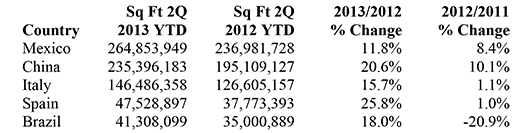
Mexico remained the top exporter in sq. ft. to the U.S. through 2Q 2013 YTD with a 31.6% share. China held the second position, making up 28.1% of imports (in sq. ft.). Italy was in third place with a 17.5% share.
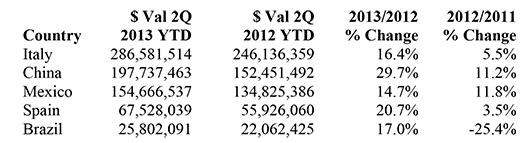
On a dollar basis Italy continued to hold the top exporter position, making up 34.7% of U.S. imports. The next two highest shares belonged to China and Mexico, which had 23.9% and 18.7% of the $ value of U.S. imports, respectively.
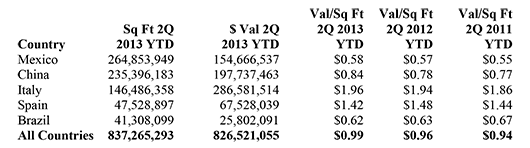
The $ value/sq. ft. of all tile imports rose from $0.96 (2Q 2012 YTD) to $0.99 for 2Q 2013 YTD.
The top five countries from which tiles were imported through 2Q 2013 YTD based on sq. ft. were:
The top five countries from which tiles were imported through 2Q 2013 YTD based on total U.S. $ value (including duty, freight, and insurance) were:
The average values of tile from the top five countries (based on sq. ft.) from which tiles were imported through 2Q 2013 YTD were:
U.S. Shipments
U.S. shipments (less exports) were at 385.2 million sq. ft. through 2Q 2013 YTD, up 5.6% from 2Q 2012 YTD.
Exports
U.S. exports through 2Q 2013 YTD were at 21.7 million sq. ft., down 7.7% vs. 2Q 2012 YTD. The vast majority of these exports (in sq. ft.) were to Canada (61.9%), Mexico (17.8%), and China (6.2%).
(Source: U.S. Commerce Dept.)

0 Comments